Multivariate Analysis
Overview
Multivariate statistics involves the observation and analysis of more than one statistical outcome variable at a time. Rather than treating variables in isolation, multivariate methods reveal the joint behavior of multiple measurements simultaneously, uncovering patterns, correlations, and structures that would remain hidden in univariate analyses. This integrated approach has become indispensable across science, engineering, finance, and social sciences wherever complex systems produce multiple interrelated measurements.
The Challenge of Multiple Variables: When analyzing datasets with many variables, practitioners face a fundamental problem: the human mind struggles to visualize relationships in more than three dimensions, statistical noise amplifies with dimensionality, and computational complexity grows exponentially. Multivariate analysis techniques address these challenges through several complementary strategies. Some methods compress high-dimensional data into lower-dimensional spaces while preserving the most important information. Others test whether multiple outcomes change together in meaningful ways. Still others uncover hidden latent structures underlying observed correlations. Each approach serves distinct analytical goals, from exploratory data investigation to hypothesis testing to predictive modeling.
Implementation: These tools are built on robust statistical foundations implemented through NumPy, SciPy, and scikit-learn. NumPy provides the underlying numerical linear algebra operations, SciPy supplies specialized statistical functions and algorithms, and scikit-learn offers high-level interfaces with standardized preprocessing and evaluation pipelines. The integration of these libraries ensures computational efficiency, numerical stability, and compatibility with the broader Python data science ecosystem.
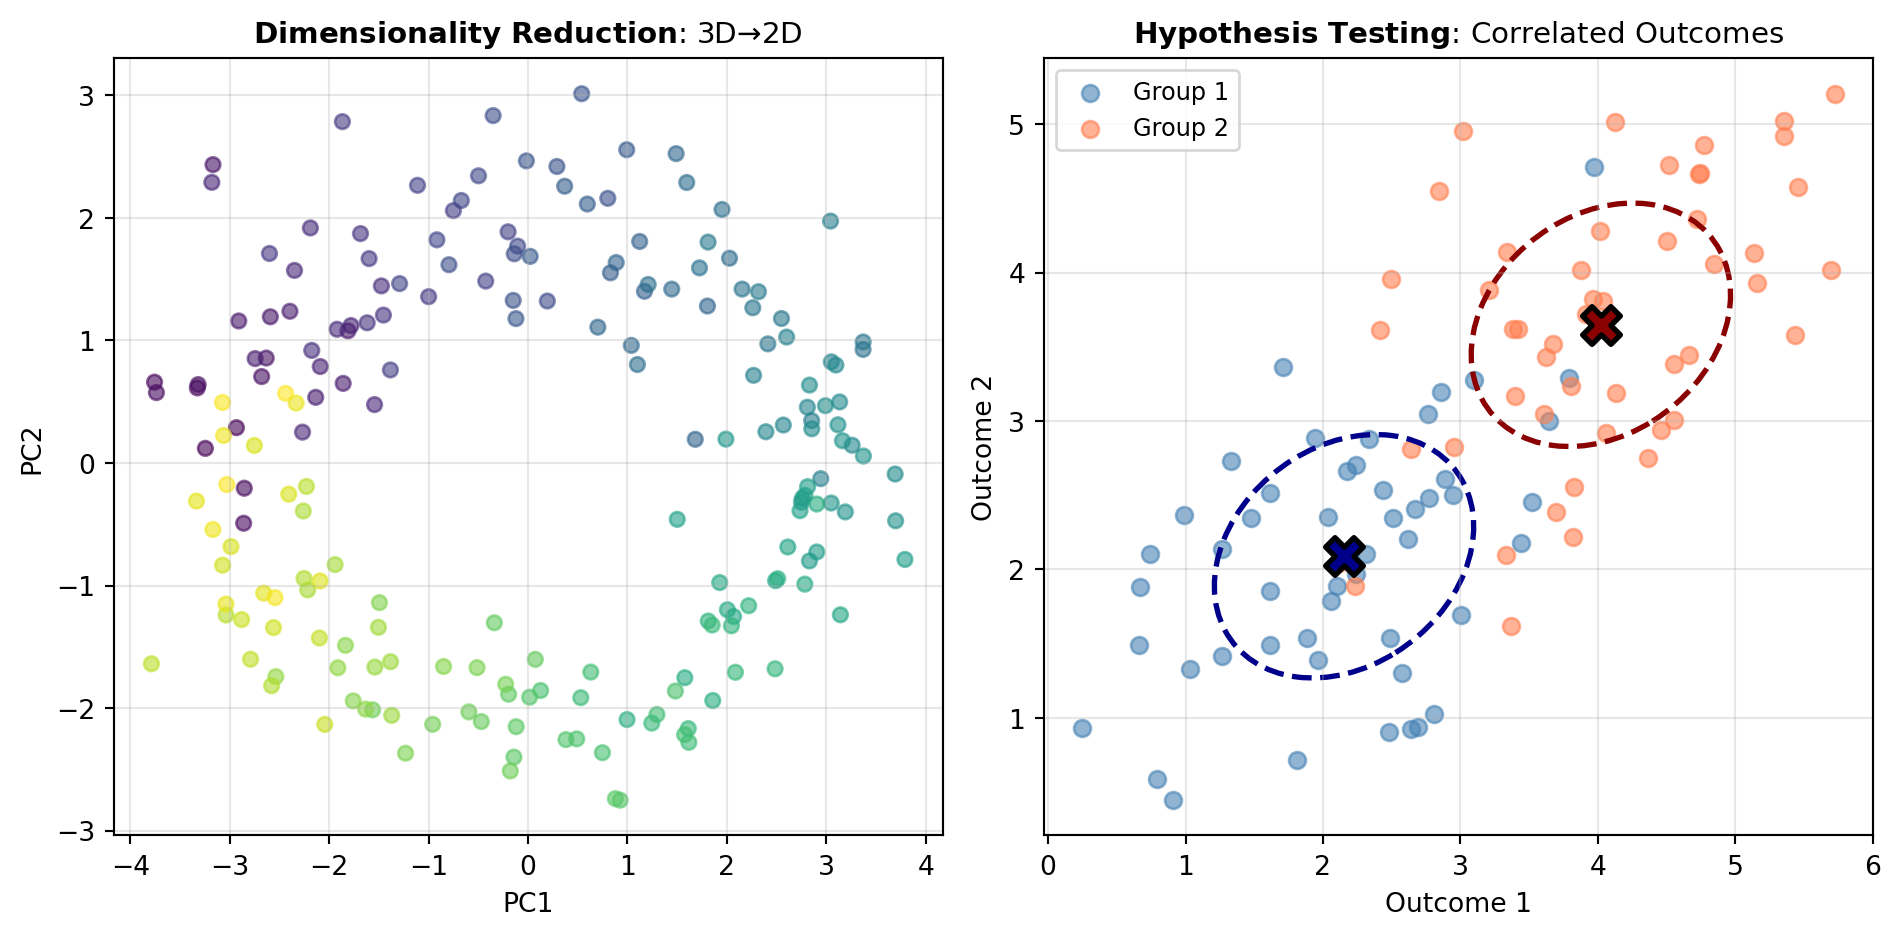
Dimensionality Reduction Methods: The PCA_ANALYSIS tool implements Principal Component Analysis, which identifies directions of maximum variance in high-dimensional data and projects observations onto a lower-dimensional subspace. PCA excels when your goal is to compress data while minimizing information loss, visualize complex patterns in 2D or 3D, or remove noise and correlations in preprocessing pipelines. Use PCA when you have many correlated continuous variables and seek an unsupervised, mathematically optimal compression.
Latent Structure Discovery: The FACTOR_ANALYSIS tool reveals hidden latent variables that generate observed correlations among measured variables. While superficially similar to PCA, factor analysis explicitly models the assumption that observed variables arise from a smaller number of unobserved latent factors plus measurement noise. This method shines in social sciences, psychology, and market research where latent constructs (like intelligence, satisfaction, or brand loyalty) cannot be directly measured but manifest through multiple observed indicators. Factor analysis also provides rotation options that make latent factors more interpretable by emphasizing distinct patterns.
Hypothesis Testing with Multiple Outcomes: The MANOVA_TEST tool performs Multivariate Analysis of Variance, extending classical ANOVA to settings where you have multiple dependent variables. MANOVA answers questions like: “Does this treatment affect the suite of outcomes together?” by testing whether group centroids differ in multivariate space while accounting for correlations among outcomes. Use MANOVA when experimental designs produce multiple response variables and you want to avoid the multiple-comparison problem of conducting separate ANOVAs.
Relating Two Variable Sets: The CANCORR tool implements Canonical Correlation Analysis, which identifies linear combinations of variables in one set that maximally correlate with linear combinations in another set. This specialized technique answers questions about overall association between two blocks of variables and reveals which combinations drive relationships. Use CCA when you have two distinct groups of variables (e.g., clinical measurements versus lifestyle factors) and want to understand their joint variation patterns.
Figure 1 illustrates how these methods address different analytical questions: dimensionality reduction versus latent structure discovery, and univariate testing versus multivariate hypothesis tests with correlated outcomes.
Tools
| Tool | Description |
|---|---|
| CANCORR | Performs Canonical Correlation Analysis (CCA) between two sets of variables. |
| FACTOR_ANALYSIS | Performs exploratory factor analysis with rotation. |
| MANOVA_TEST | Performs Multivariate Analysis of Variance (MANOVA) for multiple dependent variables. |
| PCA_ANALYSIS | Performs Principal Component Analysis (PCA) for dimensionality reduction. |