Regression Models
Overview
Regression analysis is a foundational statistical technique that models the relationship between a dependent variable (target) and one or more independent variables (predictors). It answers questions about how variables are related, enables prediction and forecasting, and provides insights for decision-making across domains from economics to engineering. Whether estimating demand curves, forecasting sales, or understanding the impact of policy changes, regression remains the most widely used statistical modeling approach.
Background and Importance
Regression was formalized in the 19th century by Francis Galton and Karl Pearson, who observed that extreme values tend to “regress” toward the mean. Today, regression is central to econometrics, biostatistics, machine learning, and countless applied fields. The power of regression lies in its interpretability: regression coefficients quantify the direction and magnitude of relationships, making it invaluable when understanding why is as important as what.
Implementation Libraries
These tools leverage statsmodels, a comprehensive Python package that provides robust implementations of classical econometric and statistical methods. The underlying computations use NumPy and SciPy for numerical linear algebra and optimization.
Core Regression Models
The Ordinary Least Squares (OLS) framework, implemented in OLS_REGRESSION, is the standard starting point. It minimizes the sum of squared residuals and provides closed-form solutions, interpretable coefficients, and classical hypothesis tests. Use OLS when your data satisfies its assumptions: linear relationships, homoskedasticity (constant variance), and independent errors.
Specialized Regression Techniques
When OLS assumptions are violated, specialized methods offer solutions:
Weighted Least Squares (WLS), accessed via WLS_REGRESSION, handles heteroskedasticity by weighting observations inversely to their variance. This is essential when measurement precision varies across observations or when dealing with aggregated data.
Generalized Least Squares (GLS), provided by GLS_REGRESSION, addresses both heteroskedasticity and autocorrelation, common in time-series data where consecutive errors are correlated.
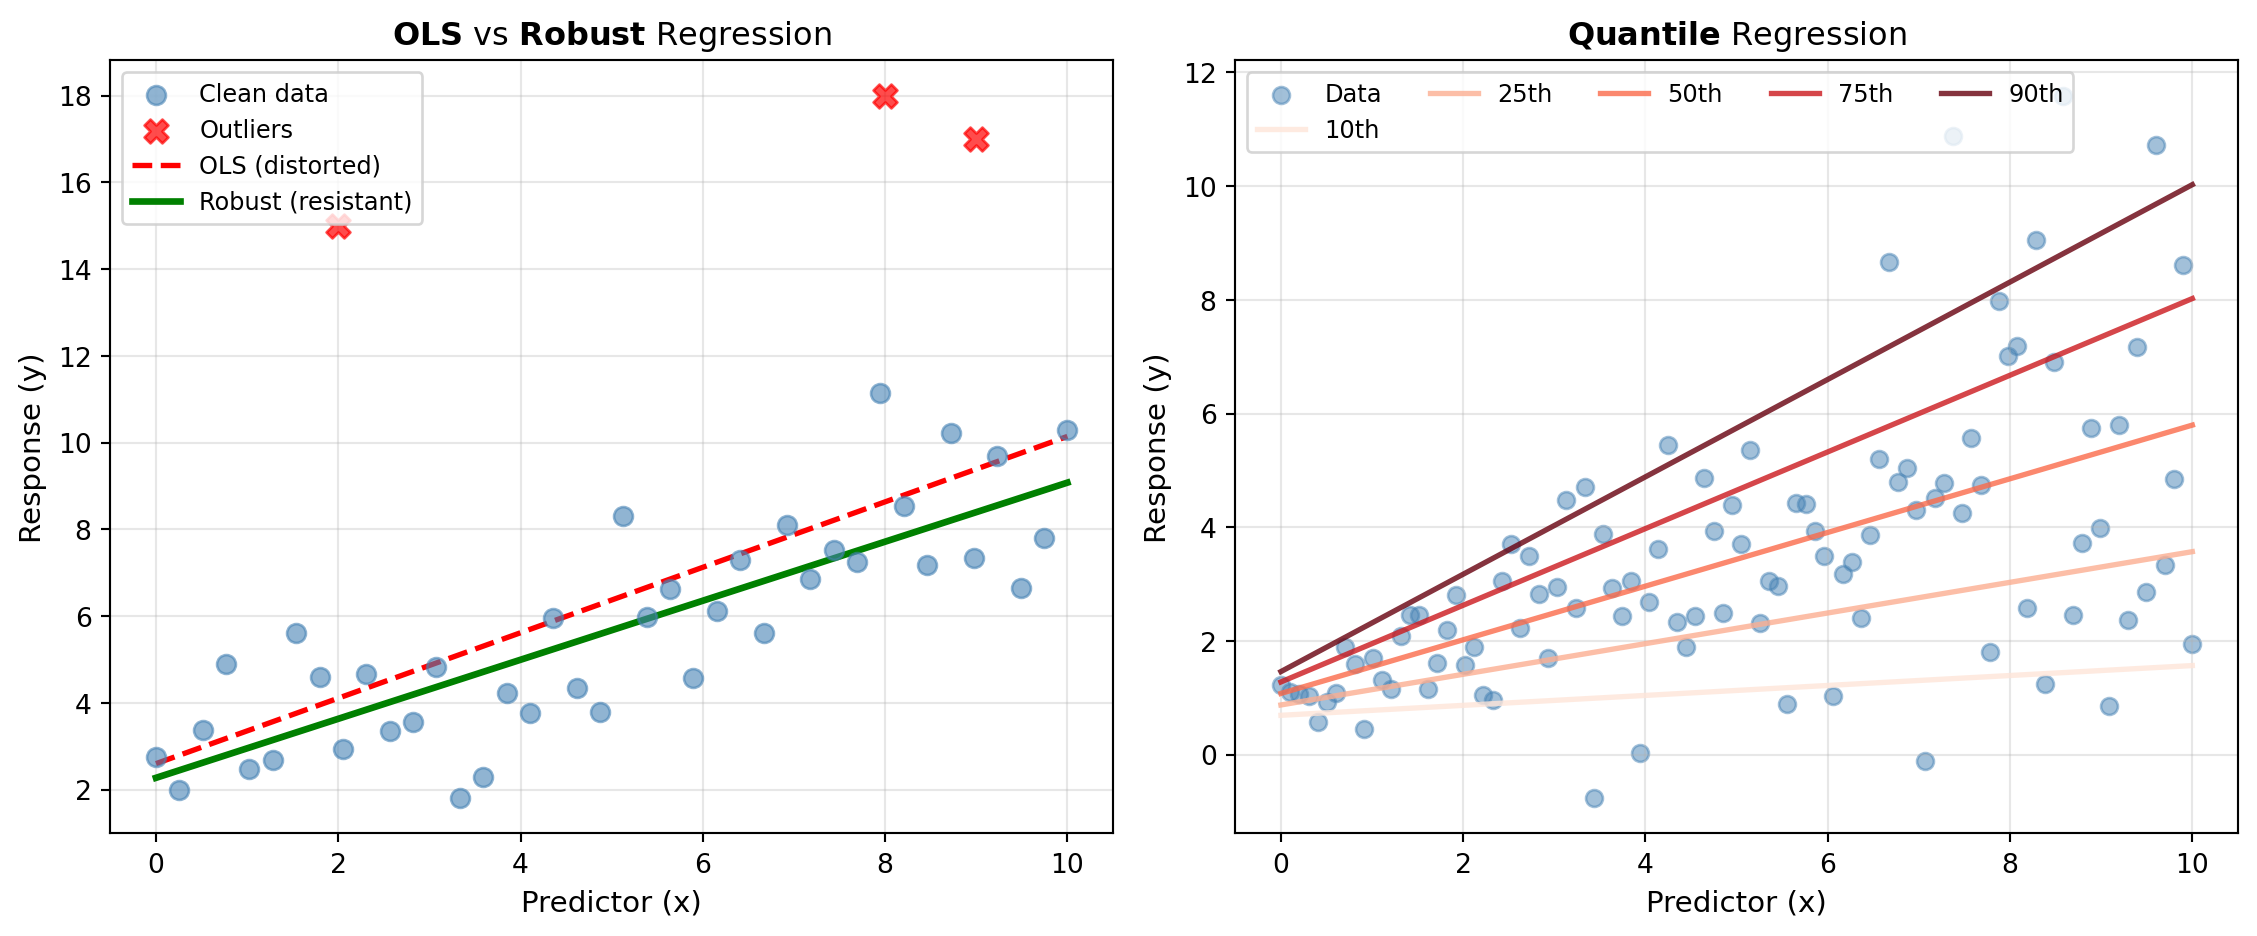
Robust Methods, such as ROBUST_LINEAR_MODEL, use M-estimators to downweight or eliminate the influence of outliers. This approach protects against extreme values that would distort OLS estimates.
Quantile Regression, available through QUANTILE_REGRESSION, estimates conditional quantiles (medians, percentiles) of the response distribution rather than the mean. This reveals how predictors affect different parts of the distribution, uncovering heterogeneous effects and providing robustness to outliers without explicit trimming.
Diagnostics and Validation
Regression diagnostics are crucial for model assessment. OLS_DIAGNOSTICS performs comprehensive residual analysis—testing for normality, heteroskedasticity, and autocorrelation. INFLUENCE_DIAG identifies which observations disproportionately drive the regression fit through leverage and influence statistics (Cook’s distance, DFBETAS). REGRESS_DIAG combines multiple diagnostic tests into a single comprehensive assessment.
Specification and Misspecification
A poorly specified model—one with omitted variables, wrong functional form, or incorrect variable selection—produces misleading estimates despite passing residual tests. SPECIFICATION_TESTS detects common forms of misspecification, helping you validate that your model adequately represents the underlying relationship.
When to Use These Tools
Use linear regression when you have a continuous target variable and seek interpretable relationships. Choose OLS for well-behaved data; switch to WLS or GLS if heteroskedasticity or autocorrelation is evident. Apply robust methods when outliers are present but you cannot justify removing them. Use quantile regression to understand distributional effects or when the relationship varies across the distribution of the target. Always run diagnostics after fitting to verify assumptions and identify potential improvements.
Tools
| Tool | Description |
|---|---|
| GLS_REGRESSION | Fits a Generalized Least Squares (GLS) regression model. |
| INFLUENCE_DIAG | Computes regression influence diagnostics for identifying influential observations. |
| OLS_DIAGNOSTICS | Performs diagnostic tests on OLS regression residuals. |
| OLS_REGRESSION | Fits an Ordinary Least Squares (OLS) regression model. |
| QUANTILE_REGRESSION | Fits a quantile regression model to estimate conditional quantiles of the response distribution. |
| REGRESS_DIAG | Performs comprehensive regression diagnostic tests. |
| ROBUST_LINEAR_MODEL | Fits a robust linear regression model using M-estimators. |
| SPECIFICATION_TESTS | Performs regression specification tests to detect model misspecification. |
| WLS_REGRESSION | Fits a Weighted Least Squares (WLS) regression model. |